Amazon seller analytics

You don't need another chart. You need to know what changed and what it cost.

Skumetrica loads your Seller Central data every night. In the morning, Claude writes its conclusions: what moved, where the money went, and what to do first.

Free for 14 days, no card. You connect Amazon next.

A real reading, written for a demo account from 252 computed facts. A figure Claude cannot point back to one of them is refused before the reading is ever stored.

Claude's Conclusions

Jul 31 · 6:25am

Sales grew but the bottom line fell, and almost all of the drop came from what the goods cost, not from Amazon.

Revenue is $28,473, +8.0% on the previous 30 days, and almost all of that came from selling more units rather than charging more. Yet net profit fell by −$1,357, and −$1,073 of that move came from the cost of goods alone — fees and advertising barely shifted. Meanwhile several storefronts have run dry: the A4 multipack and A3 mat listings on Amazon.co.uk have nothing sellable, and Canada is days away on the 11x17 mat.

−$1,357Change in the bottom line against the previous 30 days −$1,073How much of that came from what the goods cost −$253How much came from what Amazon collected −$30.30How much came from Amazon's fees

Written by Claude · 252 facts · figures computed by Skumetrica
Why you can believe the figures

The hard part is not the arithmetic. It is knowing when the arithmetic is not ready.

Amazon posts fees days to weeks after the sale. Storefronts do not change day together. Advertising is billed somewhere else entirely. A tool that ignores any of that will show you a margin that is simply wrong — and it will look exactly like a margin that is right.

So Skumetrica says so instead. Every line below is a real message from the product.

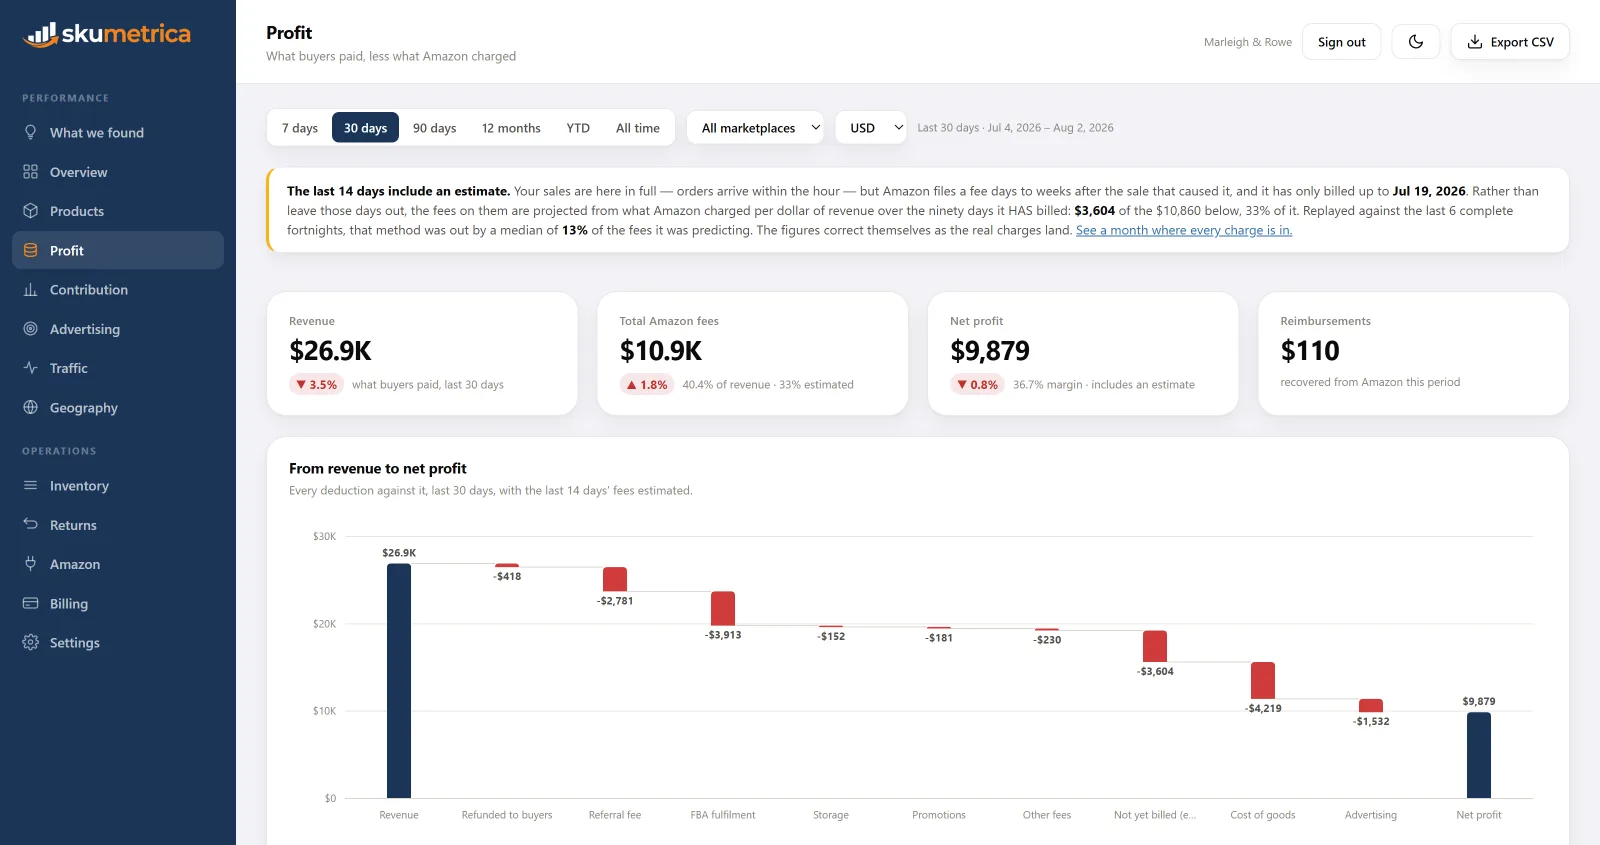
The last 14 days include an estimate. Your sales are here in full — orders arrive within the hour — but Amazon files a fee days to weeks after the sale that caused it. Rather than leave those days out, the fees on them are projected from what Amazon charged per dollar of revenue over the ninety days it HAS billed: $3,604 of the $10,860 below, 33% of it.

Profit, on any window Amazon has not finished billing. You get the bottom line rather than a blank card, and you are told which part of it is a projection.

Replayed against the last 6 complete fortnights, that method was out by a median of 13% of the fees it was predicting.

The same banner, one sentence later. The estimate publishes its own error bar, measured by running the method against months it can already check.

Today · Thursday in PDT, and each marketplace on its own (assumed)

The timezone was inferred from where you sell, not told to us. The word "assumed" stays until it is.

The data does not say who cancelled them or why, so this is a flag rather than a finding.

From Claude's Conclusions, declining to draw a conclusion the figures do not support.

What it does

Every screen answers a question. None of them make you do the subtraction.

The same two groups the app itself is organised into: what the business did, and what it needs you to do about it.

Performance

Overview

Today measured against the same hour on the days before it, not against whole days — otherwise every morning reads as a collapse. Revenue, units, conversion, buy box and where each dollar went.

Products

Every ASIN with revenue, units and sessions, and two conversion rates: by unit and by order. They are not the same number, and the gap between them tells you whether people are buying more than one.

Profit

The fees Amazon actually charged, taken from the Finances API rather than estimated from a rate card. Gross revenue down to net profit as a waterfall: referral, fulfilment, storage, promotions, cost of goods, advertising.

Advertising

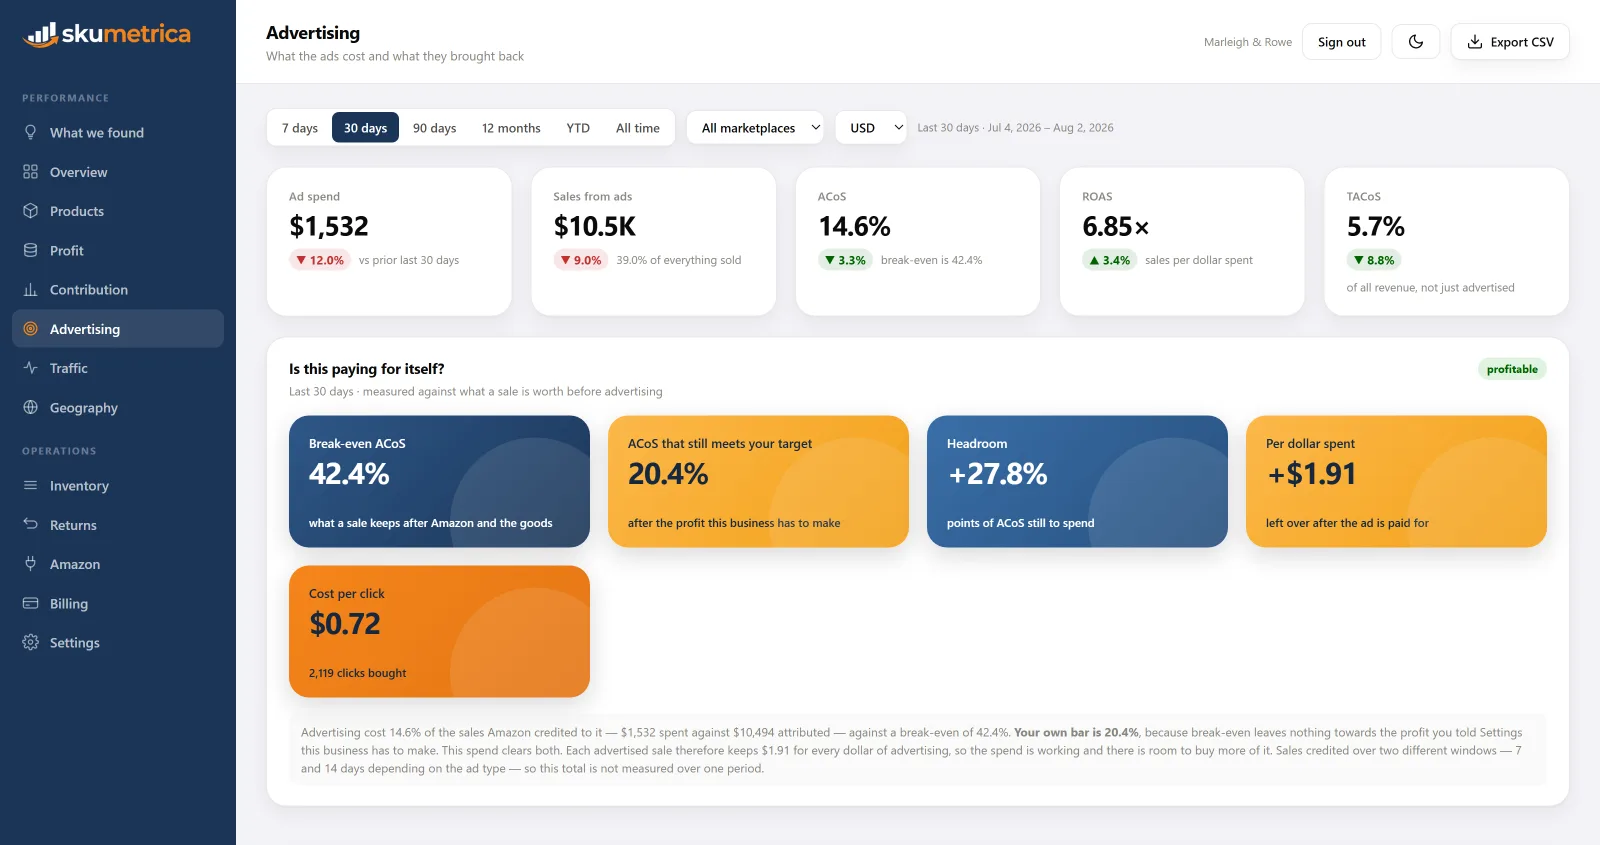
Break-even ACoS worked out from your own margin rather than a rule of thumb off a forum — and, once you have said what the business needs, the ACoS that still leaves you that. Campaign by campaign, the search terms people really typed, the spend that bought nothing, and an honest answer about how much of it those buyers would have spent anyway.

Traffic

Sessions, page views and buy box share by product and by storefront, so a drop in sales can be traced to fewer visitors, a worse conversion or a lost buy box.

Geography

Where the orders ship, by country and by state, and what each one is worth.

Operations

Inventory

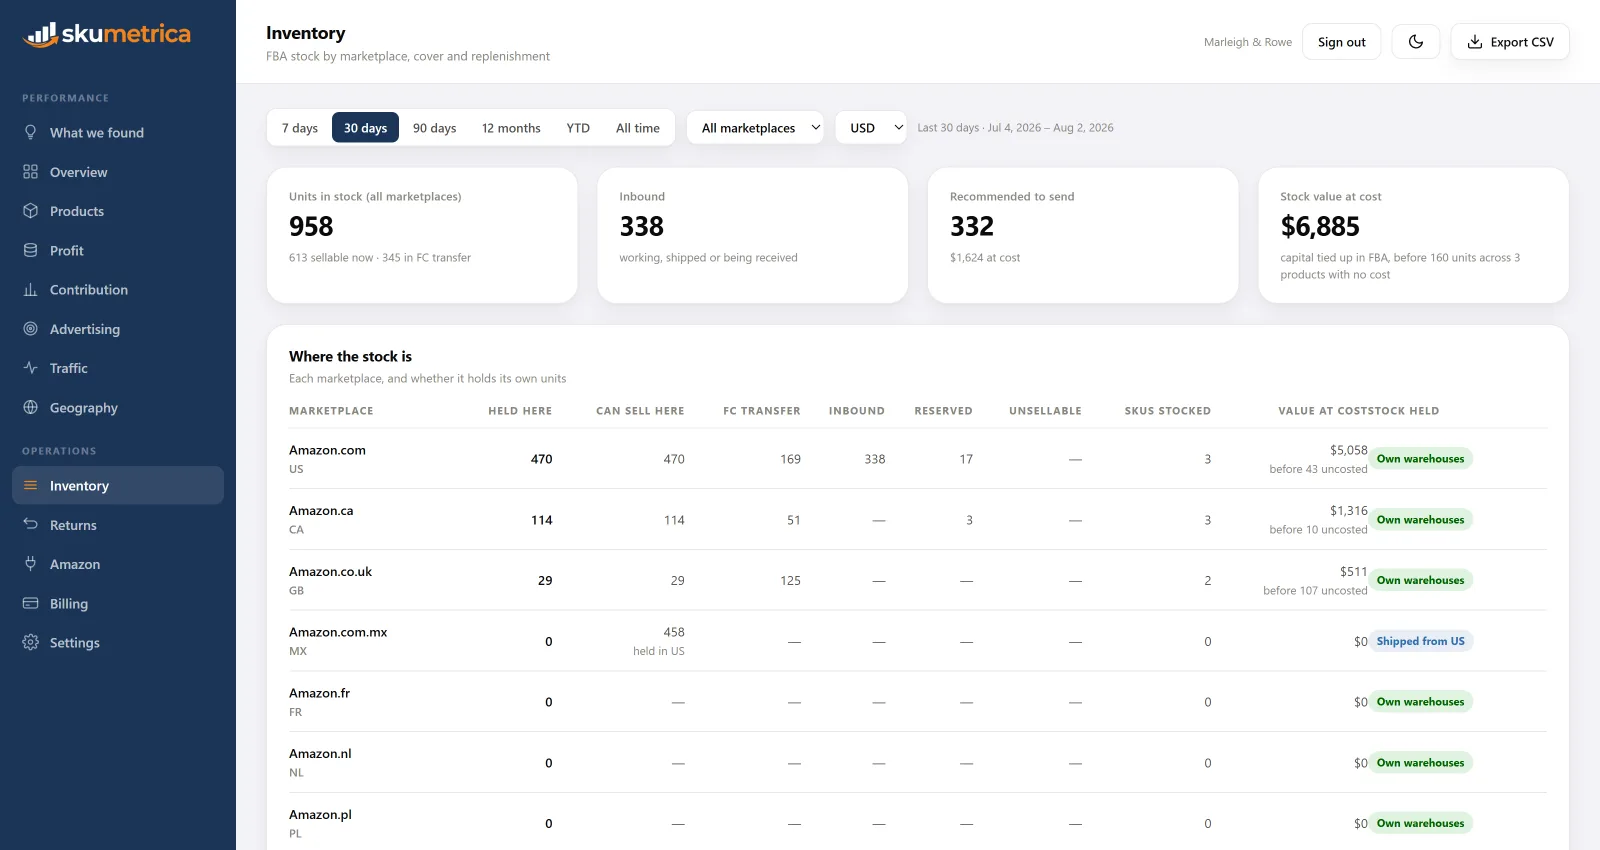
Units sellable, in transfer between fulfilment centres, inbound, reserved and unsellable — per storefront, not pooled. Days of cover, what Amazon recommends you send, and the capital sitting in FBA at your own cost.

Returns

What came back and the reason given. A parcel that could not be delivered is a carrier problem and "not as described" is a listing problem, so they are counted apart rather than added up into a rate.

Alerts

Only things you can act on. Nothing fires on missing data: a stalled load is reported as a stalled load, because an alerting system that goes quiet when its inputs die is worse than none.

Marketplaces

Thirteen storefronts across North America, Europe and the Far East. Each is counted on its own local midnight, because Amazon.co.uk rolls over eight hours before Amazon.com. Read the whole account in any currency you hold a rate for, and a dollar that is not a US dollar always says so.

Costs

Your landed cost per unit, so that the words "net profit" mean net profit — per marketplace, because freight into Tilbury is not freight into Ontario, and in whichever currency you actually work them out in. Until you enter them the page says what it is leaving out rather than calling the figure net anyway.

Targets

What each product has to earn for the business to be worth running — the part that is in no Amazon fee and no landed cost. Every page measures against it, and so does Claude: a product under the bar is making money and not enough of it, which is a different sentence from losing money and is never written as one.

The Profit screen: revenue falling through refunds, each Amazon fee, the not-yet-billed estimate, cost of goods and advertising to net profit

Every deduction between what buyers paid and what you kept

Refunds, referral, fulfilment, storage, promotions, cost of goods and advertising, each at what it actually cost. Amazon files its fees days to weeks after the sale, so the last fortnight has a bar of its own — Not yet billed, projected from what Amazon charged per dollar over the ninety days it has finished billing. The banner says how much of the total that is, and how far the same method has been wrong when replayed against fortnights it can already check.

The Advertising screen: a break-even ACoS of 42.4% beside the 20.4% that still meets this account's stated profit target

Break-even is the wrong bar, and it is the only one most tools know

Break-even ACoS is where a campaign stops making money — here 42.4%, and it is this account's own figure, what a sale keeps after Amazon's fees and the landed cost of the goods rather than a rule of thumb off a forum. It is still not where the campaign starts being worth running: at break-even it contributes nothing towards rent, wages or your own hours. Tell Skumetrica what each product has to earn and it works out the bar that matters — 20.4%. A campaign between the two looks profitable, is profitable, and is quietly eating the overhead. Both are on screen, because the gap is the number worth deciding on.

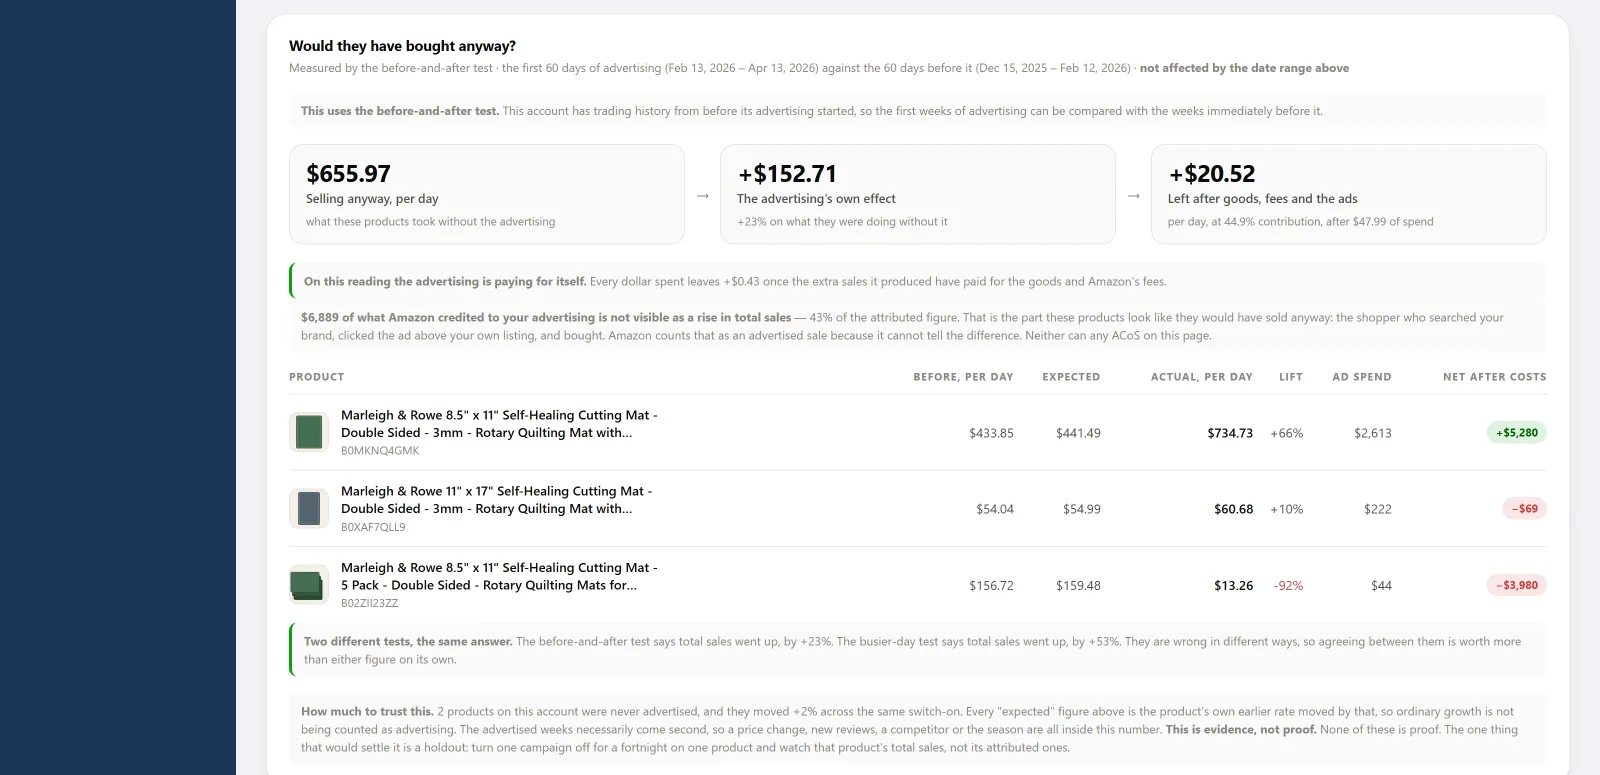
The incrementality panel, showing what the advertising added over what the products were selling anyway, product by product

And the question every ACoS quietly assumes away

Amazon credits a sale to an ad whenever the click came first — the shopper who searched your brand, clicked the ad above your own listing and bought counts the same as one you won. Here that is 43% of the attributed figure. Skumetrica measures what the advertising actually added against what the products were already doing, product by product, and one line that reads as a winner on ACoS turns out to be −$3,980 after costs. It also tells you how far to trust it: this is evidence, not proof, and the page says so in those words.

The Inventory screen, showing stock held in each Amazon marketplace, with Mexico marked as selling from stock held in the United States

Stock counted where it actually sits

Units held in Great Britain cannot be sold in Germany, so they are never added together. Mexico is marked shipped from US and its units are not counted twice, because they are already on the American shelf. The stock valuation says how many units it could not price rather than valuing them at nothing, and days of cover come from each storefront's own selling rate.

The obvious objection

Won't it write the same thing every morning?

Most days, nearly. It is a thirty-day window, so the figures drift by a few percent and the story underneath them does not move at all. Paying for a fresh paraphrase of yesterday would be paying for nothing.

So Skumetrica takes a signature of the story — which alerts are live, whether you are profitable, which way margin is going, and which of sales, fees, cost of goods or advertising is driving it. If the numbers moved but the story did not, yesterday's brief stands and the log says why. It is rewritten anyway once a week, so nothing goes stale in silence.

How it connects

You keep the keys.

Skumetrica holds no Amazon credentials of its own. You register a private application inside your own Seller Central and hand it to us, which means nothing has to be published or approved by Amazon before you can start — and you can revoke it yourself, from Seller Central, without asking us first.

Your application, not a shared one

Read-only Selling Partner access that you created and that you own. Nothing about your account is pooled with anyone else's.

Nothing is stored until it works

Credentials are encrypted at rest, and a key is only saved once Amazon has accepted it. A typo is refused on the spot rather than kept and discovered three days later as a queue of failed loads.

Advertising is a separate yes

Amazon bills advertising outside the Finances API, so it takes its own authorisation. Skip it and the product says your net profit excludes advertising, rather than quietly reporting a better margin than you have.

Pricing

The same product at every price. The tier is only how much you sell.

Every plan has every screen, every marketplace, every export and your full order history. Nothing is held back for a higher tier.

Solo

up to 1,500 orders a month

Dashboard only

$9/ month

Solo + Claude

$19/ month

Growth

up to 6,000 orders a month

Dashboard only

$19/ month

Growth + Claude

$29/ month

Scale

up to 30,000 orders a month

Dashboard only

$35/ month

Scale + Claude

$45/ month

The second line is the only difference: it adds Claude's Conclusions, written each morning by Claude against your own figures. Without it you get the same screens, the same alerts and the same exports — just nobody reading them for you. Every plan starts with 14 days free and no card, and you are never moved to a dearer tier without a week's notice on this account's own billing page.

Connecting takes about ten minutes.
Claude's first conclusions arrive the next morning.

Two years of history load in the background while you look around, and the figures fill in behind you as they arrive.